Approach 1: manually specifying legend entries
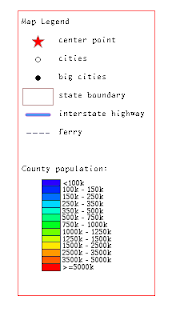
In this approach, we create a map legend image by specifying a map legend element in MapViewer's XML request. Inside the element, we add one legend entry for each style to be displayed as well as some description text. The trick here is to leave MapViewer nothing else to render: no center point, no map bounding box, and no base map or themes either. When MapViewer sees such an otherwise empty map request, it will know to generate an image that is just big enough to contain all the legend entries.
The following is one such sample XML request.
<?xml version="1.0" standalone="yes"?>
<map_request datasource="mvdemo" format="PNG_STREAM">
<legend bgstyle="fill:#ffffff;stroke:#ff0000" profile="MEDIUM" position="SOUTH_EAST">
<column>
<entry text="Map Legend" is_title="true" />
<entry style="M.STAR" text="center point" />
<entry style="M.CITY HALL 3" text="cities" />
<entry style="M.CITY HALL 4" text="big cities" />
<entry style="C.ROSY BROWN STROKE" text="state boundary" />
<entry style="L.PH" text="interstate highway" />
<entry style="L.FERRY" text="ferry" />
<entry is_separator="true" />
<entry text="County population:" />
<entry style="V.COUNTY_POP_DENSITY" tab="1" />
</column>
</legend>
</map_request>
The above request results the following legend image:

Approach 2: Fully automatic embedded map legend
In this approach, we want to display a map legend as part of the map itself, while without specifying any legend entries. Lets look at the such a map request:
<?xml version="1.0" standalone="yes"?>
<map_request
title="Oracle LBS MAP"
basemap="demo_map"
datasource = "mvdemo"
width="640"
height="480"
bgcolor="#a6cae0"
antialiase="false"
format="PNG_STREAM">
<center size="0.15">
<geoFeature render_style="m.star"
radius="1600,4800"
label="A Place"
text_style="t.Street Name" >
<geometricProperty typeName="center">
<Point srsName="SDO:8307">
<coordinates>-122.2615, 37.5266</coordinates>
</Point>
</geometricProperty>
</geoFeature>
</center>
<legend bgstyle="fill:#ffffff;stroke:#ff0000" profile="MEDIUM" position="SOUTH_EAST">
</legend>
</map_request>
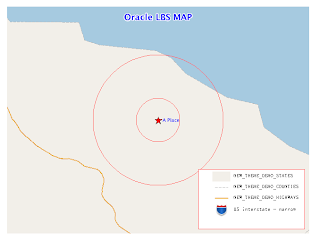
As you can see, the above request specifies a legend element without any actual legend entries inside it. So how will MapViewer create the legend in this case? It actually will look up all the themes that are visible on the result map, and displays all the styles that are used by these themes in the legend area. This is great if you are just feeling lazy and would rather MapViewer handle everything for you. The following is the map with the automatic legend:

For more information about these two approaches and the (sometimes limited) customization options, please check out MapViewer's User Guide.
Approach 3: Full manual mode
If you are an advanced user, you most likely will want more than the two approaches we just mentioned. No worries. In the 3rd approach, we will leverage a new MapViewer request to achieve complete control of legend customization and layout. Basically, with a recent MapViewer release (such as 10.1.3.3 for WebLogic), you can now request a 'sample' image of any style from Mapviewer. A typical request URL for a style image looks like this:
http://sdolnx2.us.oracle.com:7777/mapviewer/omserver?sty=M.STAR&w=25&h=25&ds=mvdemo
For the above URL, MapViewer will generate and stream back an image 25 pixels wide and high that shows the style named "M.STAR" from the "mvdemo" data source.
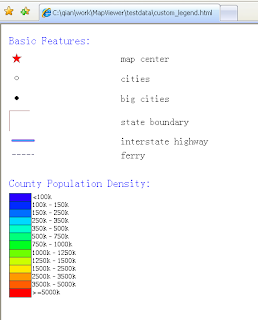
With this kind of style image URL, we can use the regular HTML table and <img> tags to fully customize what, where and how legend entries are displayed. For instance, to replicate the sample legend in Approach 1, we can use the following simple HTML table (you can also use CSS constructs to achieve much fancier layout if you so desire):
<TABLE>
<TR>
<TD>
<Font size="+1" color="blue">Basic Features:</FONT>
</TD>
<TD>
</TD>
</TR>
<TR>
<TD>
<img src="http://sdolnx2.us.oracle.com:7777/mapviewer/omserver?sty=M.STAR&w=25&h=25&ds=elocation">
</TD>
<TD>
map center
<TD>
</TR>
<TR>
<TD>
<img src="http://sdolnx2.us.oracle.com:7777/mapviewer/omserver?sty=M.CITY+HALL+3&w=25&h=25&ds=mvdemo">
</TD>
<TD>
cities
</TD>
</TR>
<TR>
<TD>
<img src="http://sdolnx2.us.oracle.com:7777/mapviewer/omserver?sty=M.CITY+HALL+4&w=25&h=25&ds=mvdemo">
</TD>
<TD>
big cities
</TD>
</TR>
<TR>
<TD>
<img src="http://sdolnx2.us.oracle.com:7777/mapviewer/omserver?sty=C.ROSY+BROWN+STROKE&w=34&h=34&ds=mvdemo">
</TD>
<TD>
state boundary
</TD>
</TR>
<TR>
<TD>
<img src="http://sdolnx2.us.oracle.com:7777/mapviewer/omserver?sty=L.PH&w=45&h=15&ds=mvdemo">
</TD>
<TD>
interstate highway
</TD>
</TR>
<TR>
<TD>
<img src="http://sdolnx2.us.oracle.com:7777/mapviewer/omserver?sty=L.FERRY&w=45&h=15&ds=mvdemo">
</TD>
<TD>
ferry
</TD>
</TR>
<TR> <!-- a separator -->
<TD>
<img src="http://sdolnx2.us.oracle.com:7777/mapviewer/myicons/t.gif" height="15" width="1">
</TD>
<TD>
</TD>
</TR>
<TR>
<TD colspan="2">
<FONT size="+1" color="blue">County Population Density:</FONT>
</TD>
</TR>
<TR>
<TD>
<img src="http://sdolnx2.us.oracle.com:7777/mapviewer/omserver?sty=V.COUNTY_POP_DENSITY&w=180&h=175&ds=mvdemo">
</TD>
<TD>
</TD>
</TR>
</TABLE>
The following is what you will see in a browser:

2 comments:
very interesting post!
Hi, i would like to ask if there's a way to wrap the text labels of the legend? Thanks...
Post a Comment